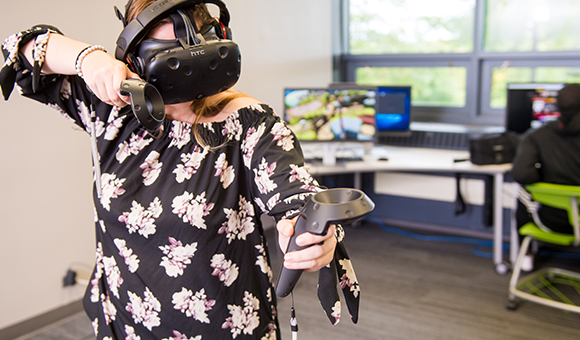
Game Design & Development - B.S.
SUNY Canton’s four-year Game Design and Development program is exclusively for students who want to design a new generation of video games and virtual reality on multiple platforms. It allows students to pursue their dreams and ambitions within the lucrative entertainment and software industry.

Career Opportunities
- Game programmers
- Computer graphics and visualization developers
- Virtual reality and augmented reality software engineer
- Modelers
- Animators
- Digital content producers
- Level designers
- Texture mappers

Employment statistics are from the Bureau of Labor Statistics 2024-2034 Occupational Outlook Handbook.
The program is designed through real-world lessons and applied game production courses that lead playable video games. Students can expect to learn design sequence, prototyping, aesthetics of design, development, testing, production, manufacturing and marketing.
Every type of game, from a simple interactive maze to the latest first-person adventure represents a series of design and aesthetic challenges. We offer a well rounded program that both emphasizes technological hard skills, including programming, in addition to courses in English and Business.
- Roberto Comella
Game Design and Development Lecturer

Career Outlook
Employment of gaming software developer, computer graphics and virtual reality engineer, multimedia artists and animators, is projected to grow 6 percent from 2014 to 2024. Projected growth will be due to increased demand for animation and visual effects in video games, movies, and television, according to the U.S. Department of Labor Bureau of Labor Statistics. The median pay scale for these positions was $63,970 per year.
Game Design & Development
Morgan Hastings
Lecturer & Program Coordinator
315-386-7542
hastingsm@canton.edu
Fall Enrollment Trends
| FT | PT | Total | |
| 2025 | 100 | 4 | 104 |
| 2024 | 109 | 1 | 110 |
| 2023 | 112 | 5 | 117 |
| 2022 | 132 | 5 | 137 |
| 2021 | 123 | 2 | 125 |
Graduation Rate Trends*
| Cohort Entering | Cohort Size | % |
| Fall 2019 | 76 | 21% |
| Fall 2018 | 57 | 12% |
| Fall 2017 | 5 | 20% |
*Graduate rates are based on first-time, full-time, degree-seeking freshmen entering in fall and graduating within 150% of time.
Degrees Conferred
| Total | |
| 2024-25 | 13 |
| 2023-24 | 25 |
| 2022-23 | 18 |
| 2021-22 | 15 |
| 2020-21 | 4 |

